Solutions · Matrix & program orgs
Most tools draw trees. Organizations are matrices.
Dotted-line managers, program assignments, and cross-boundary relationships as first-class data — modelled, analyzed, versioned, and exported to their own slide in the board deck. This is the capability almost nobody else ships.
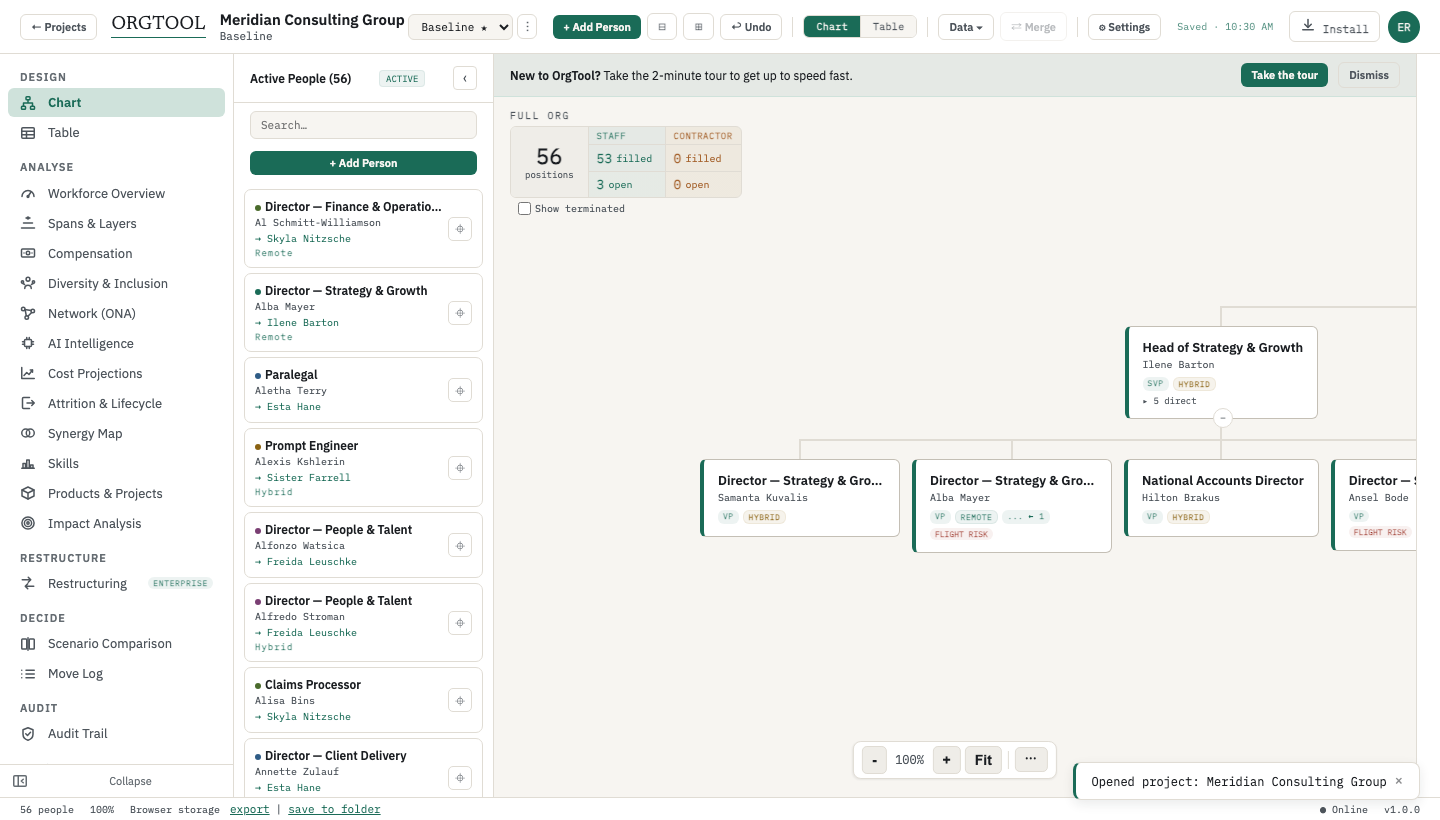
Dotted lines as data
Dotted-line managers are first-class fields on the person record — managed in the edit panel, not drawn on afterward. Cross-boundary relationships render as overlay lines on the chart and as ghost nodes when a focus view crosses subtree borders.
Programs & products
Assign people to products and programs with status tracking (Active / Planned / Sunset), browse either direction — who is on this program, what is this person on — and see assignments as badges on the chart.
Synergy & overlap
Tag roles Duplicate / Redundant / Consolidate / Retain / Review, and read the whole picture in a synergy map grouped by sub-org — the M&A and integration workhorse.
The matrix in the boardroom
The PPTX export includes a dedicated matrix-relationships slide, so the dotted-line reality survives into the deck instead of being flattened back into a tree.
Structure types, honestly
Functional, divisional, matrix, flat, or hybrid — declared at project setup and modelled accordingly, not forced through a single-parent tree.
Still one model
Matrix relationships live in the same versioned, mergeable, encrypted .orgpack as everything else — scenario comparison and impact analysis see them too.
FAQ
Questions people ask
Answers restate claims verified file-by-file against the current build — see claims/ in the site repo. Last verified July 2026.
How does OrgTool store matrix relationships?
As data on the person record: each person carries their solid-line manager plus any dotted-line managers, program/product assignments, and synergy tags. Because relationships are data, they survive scenario cloning, export to the matrix slide, and appear in comparisons — a drawing tool can't do any of that.
Can I see who works on a given product or program?
Yes — the products overview lists every product/program with its status and the people assigned; the skills overview does the same by skill and proficiency. Both read from the same model as the chart.
Why do so few tools handle matrix orgs?
Because most org tools are built on a strict tree — one parent per node — and matrix reality breaks the data model. OrgTool models the tree and the overlay separately, which is why dotted lines, programs, and cross-boundary ghosts can be first-class rather than cosmetic.