Solutions · Org design & planning
Org design as comparison, not edict.
Branch a scenario, drag the redesign, watch cost and structure react, compare against the baseline, and export the deck — the whole planning loop in one local workbench.
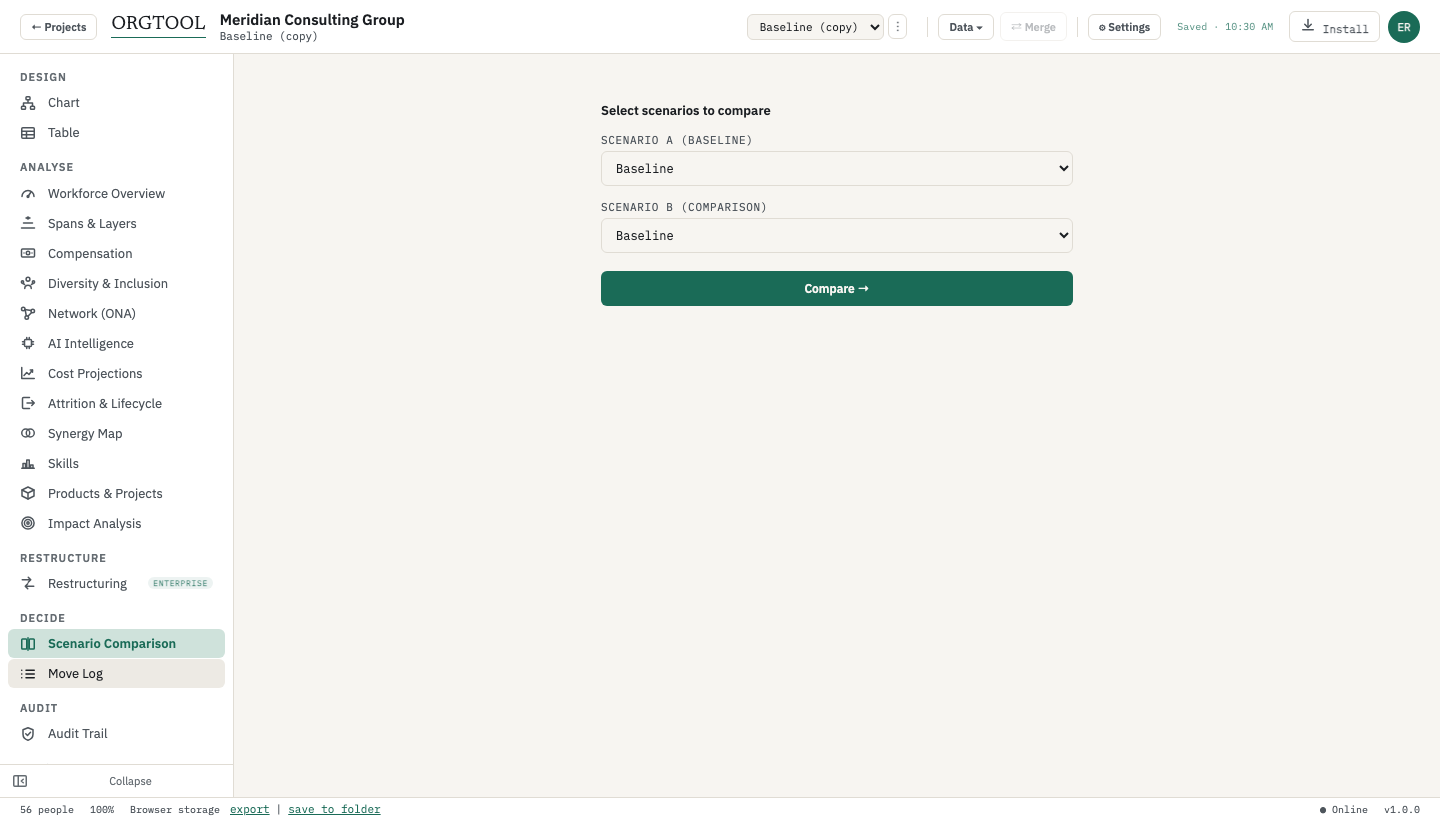
Scenarios with a baseline
Unlimited scenarios per project, one marked baseline as the reference point. Clone, rename, and compare — change is always a comparison, never an overwrite.
Design by direct manipulation
Drag-to-reassign on the chart, focus mode for any subtree, vacancies and contractors as first-class node states, conditional formatting rules to color the org by any attribute.
The grid beside the chart
A full data table with nine column groups (core, cost, AI, succession, retention, growth, position, network, synergy), inline editing, bulk operations, and saved views.
Cost, live
Current and future cost per person, grade systems with presets, cost projections and deltas that update as you drag.
Versions & move tracking
Version snapshots you can restore, a move log with promotion/demotion/lateral classification, and side-by-side scenario diffs: added, removed, moved, and what it costs.
Board-ready output
PPTX with per-manager slides, impact summary, and matrix slide; hyperlinked PDF; CSV. The deliverable is built in, not an afterthought.
FAQ
Questions people ask
Answers restate claims verified file-by-file against the current build — see claims/ in the site repo. Last verified July 2026.
How is this different from an org chart in a diagramming tool?
Diagramming tools draw pictures; OrgTool computes. Every node is a person record with cost, grade, succession, retention, and network data, so a drag on the chart changes the cost projection, the span analysis, and the scenario diff — and the deck exports itself.
Can I plan a reorg without touching the live org?
That's the core workflow: the baseline stays untouched while you branch scenarios, compare them side by side, and only ever present the option you choose. Every scenario lives in the same versioned .orgpack on your machine.
What does getting started look like?
Drop a CSV export from any HRIS — columns auto-map, manager references resolve — and the chart renders in under a minute, locally. The free plan covers one org of up to 25 people; see the 30-minute run for the full first-session arc.